
How Econometrics Solve It's Problems with It's Own Tools
Solving Data Collection Problem from the Econometrics Perspective

I recently discovered a paper which was written in 2019 (don’t blame me as I am late, since I am still an undergraduate). It is about the optimization of data collection process, which is considered to be must in order to keep econometrics researches fresh. The paper attracted me as it covers a subject which has a potential to directly affect the economic environment.
The paper basically asserts that using econometric and quantitative tools in optimization of data collection processes will be beneficial from both economic and statistical aspects. The writers of the paper construct the data collection problem on the constrained optimization concept where there is a budget that is to be used and the objective function is to acquire estimates of sample parameters as significant as possible. For the variables of objective function the number of observations to be monitored and the number of covariates are examined. The paper emphasizes the trade-off between the number of observations and number of covariates. As we might expect, it is assumed that each variable has diminishing marginal returns in terms of their contribution to the statistical significance of the model.
In the paper one would see a basic example of how to employ economotric approach to data collection optimization problem. A treatment effect is to be decided whether it is significant or not on the treated individuals. Therefore one can collect both post-treatment and pre-treatment characteristics of each observation. There is also the distinction of using average values and individual values, where the model which uses individual values has lower model variances. In one of the model, post-treatment observations are used, and on the other both pre and post-treatment characteristics of each observations are collected. You can see all the specification of both two alternatives in below.
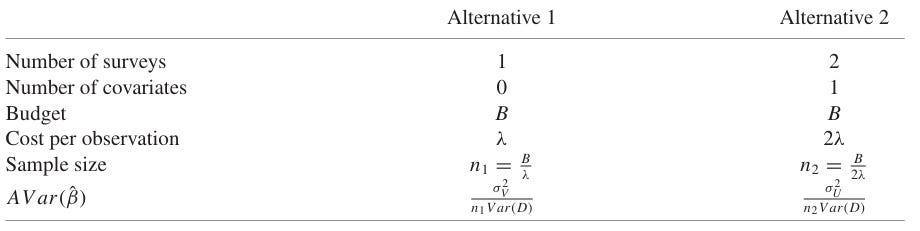
As you can see while in the first alternative the sample size is two times of the second alternative, in second alternative it collected both pre and post-treatment characteristics. The reason behind why sample size of first alternative is twice of alternative two, the cost of collecting pre-treatment characteristics in alternative 2 multiplies the cost of collecting, since it was assumed that collecting the characteristics of each observation of pre and post-treatment is equal to each other. And I should indicate that AVar represents the asymptotic variances where the variance of the estimators are divided by the sample size. To represent the functional forms of each alternative:
In the model D represents the treatment indicator which is randomly assigned to individuals and X is the pre intervention occurences. Thus in the model of second alternative we assume that other than the treatment parameter, the pre-treatment observations are important part of the explanation in the post-treatment results.
So, it comes to which one of the alternatives is the most efficient one and gives us more significant results. In order to answer this question the paper evaluates in terms of the variances of the estimators. If the below situation is valid, then one would select the first alternative over second
It is indicated that the variance of the error term of first alternative can be written in terms of the variance of the error term of the second alternative, since the error term of first equals to sum of error of the second plus the X part with coefficient.
If we replace this equation to the bigger-than expression of the asymptotic variances, we would get:
Since the sample size of first alternative is two times bigger than the second one, we can rewrite this expression:
The left side of the expression actually corresponds to a very known parameter.
The right side equals to the r-squared of the model of regressing Y on to X, which measures the individual affect of X variable on explaining the variance of Y. Thus if the r-squared is bigger than 1/2, then one should select the second alternative, since asymptotic variance of second alternative exceeds the first one’s. This makes sense, since if X variable is an important part when it comes to explaining the variance in Y, then we should include it.
As it was indicated in the paper also, the above structure for optimization of data collection process are very hard apply in real world. This is because, for instance, we would expect to see different costs of collecting data of the pre-treatment characteristics, and the cost of increasing the sample size has a complicated structure in terms of function. Thus this part represents an basic instance of the structure in order to simplify understanding.